Building a Raspberry PI Weather Station
ByHaving moved to the US two years ago, my son Tagir now has to do annual science fair projects at school, which are a great opportunity for him to learn about the scientific method and how to run experiments and analyse data. For his 7th grade project this year, as he’s super interested in electronics and programming, we decided to do a weather experiment and collect the data using a Raspberry PI and Outlyer.
As we live in San Francisco, also known as “Fog City”, we’re in the perfect location to analyse the effects of weather, as it varies so frequently across the city each day. The science project was to find out if there was a correlation between wind speed and air pressure. This meant our Raspberry PI would need to collect data on those two variables and store the data somewhere we could graph an analyse it over time. Naturally we chose Outlyer for storing and analysing the data.
We did some research on how to build a simple weather station to measure these two variables using a Raspberry PI, but to be honest the solutions didn’t exist anymore (for example on the official Raspberry PI website they have an entire section on building a weather station using a kit from Oracle which you could only get a couple of years ago from a school that applied for them), or too complicated, trying to replicate the entire Oracle kit from scratch, a little too complicated for a 12 year old.
So instead we pieced together a simple weather station with just the key components we needed to measure air pressure and wind speed, and then use some simple Python scripts to push the data into Outlyer for storage and analysis. Below are the complete instructions on how to build the project so you can also build a simple but effective weather station at home yourself too!
Parts List
We originally bought a Raspberry PI 3 Starter Kit a while back which provided a breadboard and connectors to attach all the components together to the Raspberry PI which meant we only had to buy the sensors and power supply to finish the project. Here is the full parts list if you’re starting from scratch:
- Raspberry Pi 3 Ultimate Starter Kit ($89.99)
- Diymore Digital Breakout BME280 Temperature Humidity Barometric Pressure Sensor Module ($9.98)
- Adafruit MCP3008 8-Channel 10-Bit ADC ($6.50)
- Adafruit Anemometer ($44.95)
- 12V Power Supply ($9.99)
Total Cost: $161.41 + Shipping & Taxes
Measuring Pressure with a Digital Barometer (BME280)
The BME280 chip is a very cheap and simple digital barometer that can also measure temperature and humidity as well. We used this blog from raspberrypi-spi to help us get started with the wiring and source code.
The BME280 chip uses the IC2 bus interface on the Raspberry PI to send data. This isn’t enabled by default so you need to enable it so you can measure the readings from the chip.
Once enabled, wiring up the chip on the breadboard is relatively simple:
| BME280 Pin | GPIO Pin |
| VIN | 2 (5V) |
| GND | 6 (GND) |
| SCL | 5 (SCL) |
| SDA | 3 (SDA) |
Once connected you can test if the device is working by running the following command on your Raspberry PI:
sudo i2cdetect -y 1You should see the device on address 0x76 or 0x77. The blog also provides a Python library to read the chip, however it assumes that you have i2c-tools and python-smbus installed too for the library to work:
sudo apt-get install i2c-tools
sudo apt-get install python-smbus
wget https://bitbucket.org/MattHawkinsUK/rpispy-misc/raw/master/python/bme280.py
Running the script should show something similar to the results below:
python bme280.py
Chip ID         : 96
Version         : 0
Temperature     : 24.11C
Pressure        : 1010.20420804 hPa
Humidy          : 65.0525292551 %
Measuring Wind Speed with an Analogue Anemometer
This was the hardest part to design and source. There’s a lot of electronic Anemometer’s out there that work in different ways. We finally settled on a relatively cheap and simple Anemometer from Adafruit, that sends an analogue voltage based on how fast the cups are spinning. There isn’t much information online about the sensor other than the output voltage will range from 0.4V (0 m/s wind) up to 2.0V (for 32.4m/s wind speed), and that it requires a 7-24v power supply to operate properly. We used a 12V power supply ourselves with success.
Because the Raspberry PI doesn’t have the ability to read analogue signals from the Anemometer, we had to also add an Analogue-to-Digital Converter (ADC) that could take the output voltage of the Anemometer and send a digital value to the Raspberry PI that could be measured. After doing some research we found most people use the MCP3008 8-Channel 10-Bit ADC and this blog provided great instructions on how to connect and use it with the Raspberry PI.
In summary, 10bits allows for 1024 step values, or 0-1023 where 0 is ground and 1023 is the 3.3V refence voltage the chip is connected too. That means for our Anemometer, which ranges from 0.4V to 2.0V it would measure values from 125 to 625, a 500 step range with each step representing 0.0648m/s of wind speed.
First we needed to provide a 12V power supply to the Anemometer, which we did using a simple 12V DC power supply that we soldered some wires too to provide power to our breadboard. These then were connected to the Anemometer’s brown wire for the positive of the power supply and black wire for the ground of the power supply. The 3rd blue wire of the Anemometer provides the output voltage to measure.
When measuring the output power of the Anemometer, because its on a seperate power supply from the Raspberry PI (which can only provide up to 5V by itself), you also need to ensure that the AGND of the ADC is connected to the 12V power supply ground, not the Raspberry PI ground, for an accurate measurement. The chip itself also needs to run off the Raspberry PI’s 3.3V supply as well and uses the Raspberry PI’s SPI bus interface to communicate:
| MCP3008 Pin | GPIO Pin | Anemometer |
| VDD | 1 (3.3V) | |
| VREF | 1 (3.3V) | |
| AGND | 12V GND | |
| CLK | 18 | |
| DOUT | 23 | |
| DIN | 24 | |
| CS | 25 | |
| DGND | 9 (GND) |
We connected the blue wire of the Anemometer to CH0 channel of the ADC for reading the output voltage measurements.
To read the measured voltage from the MCP3008 ADC, Adafruit provides a Python library here you can easily install using pip:
sudo pip install adafruit-mcp3008Putting it All Together
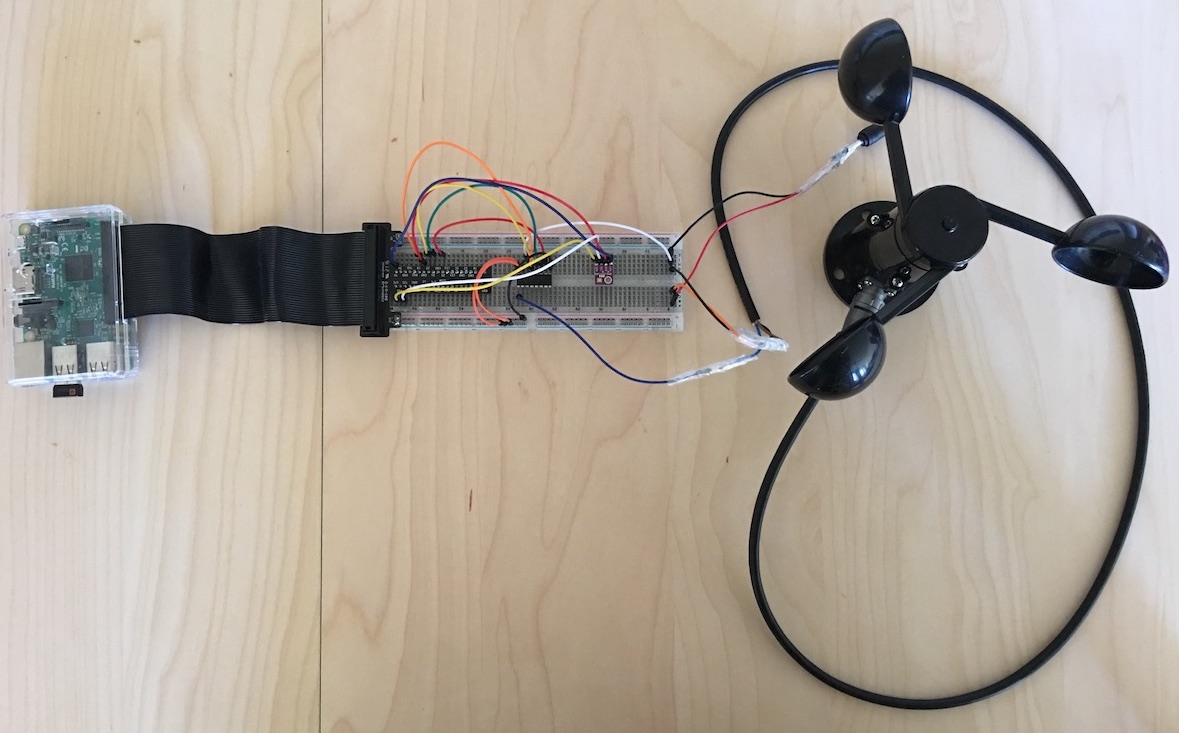
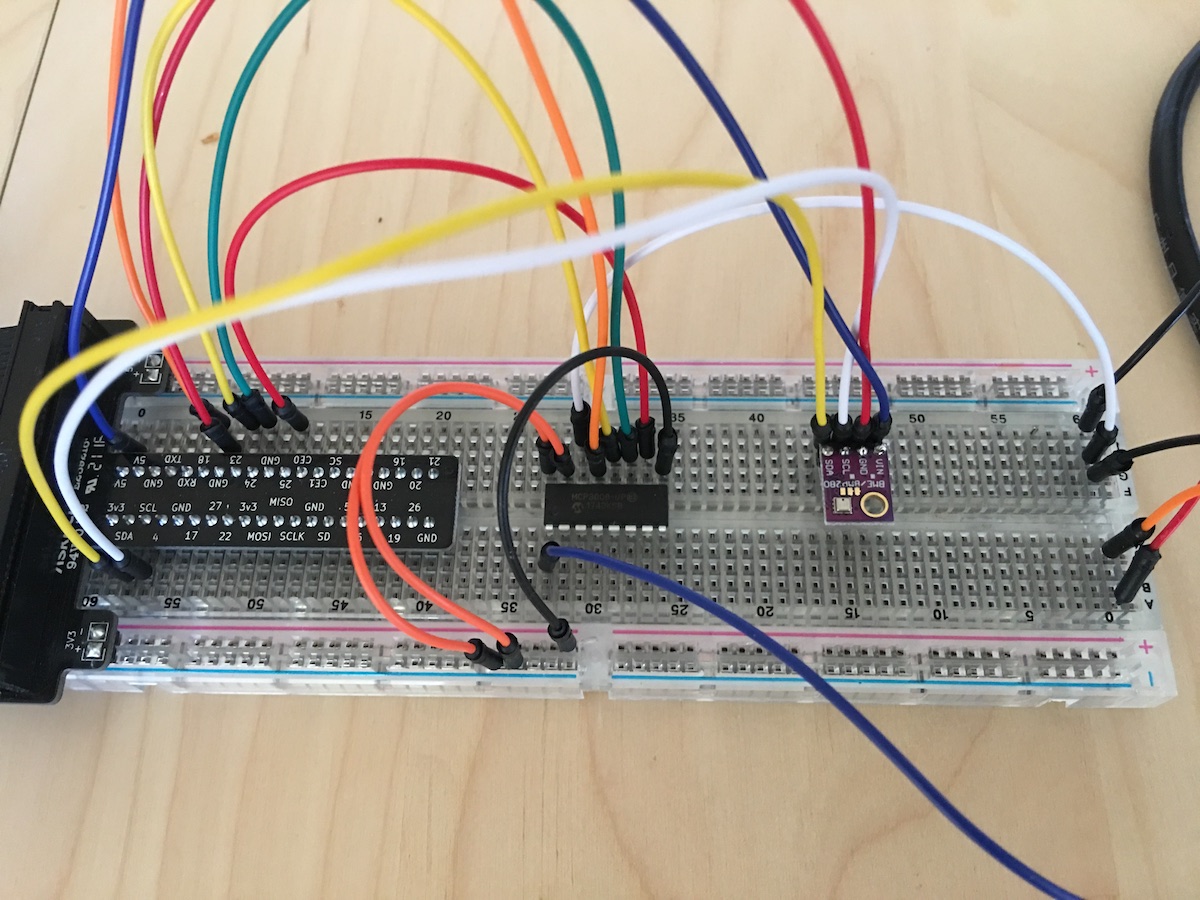
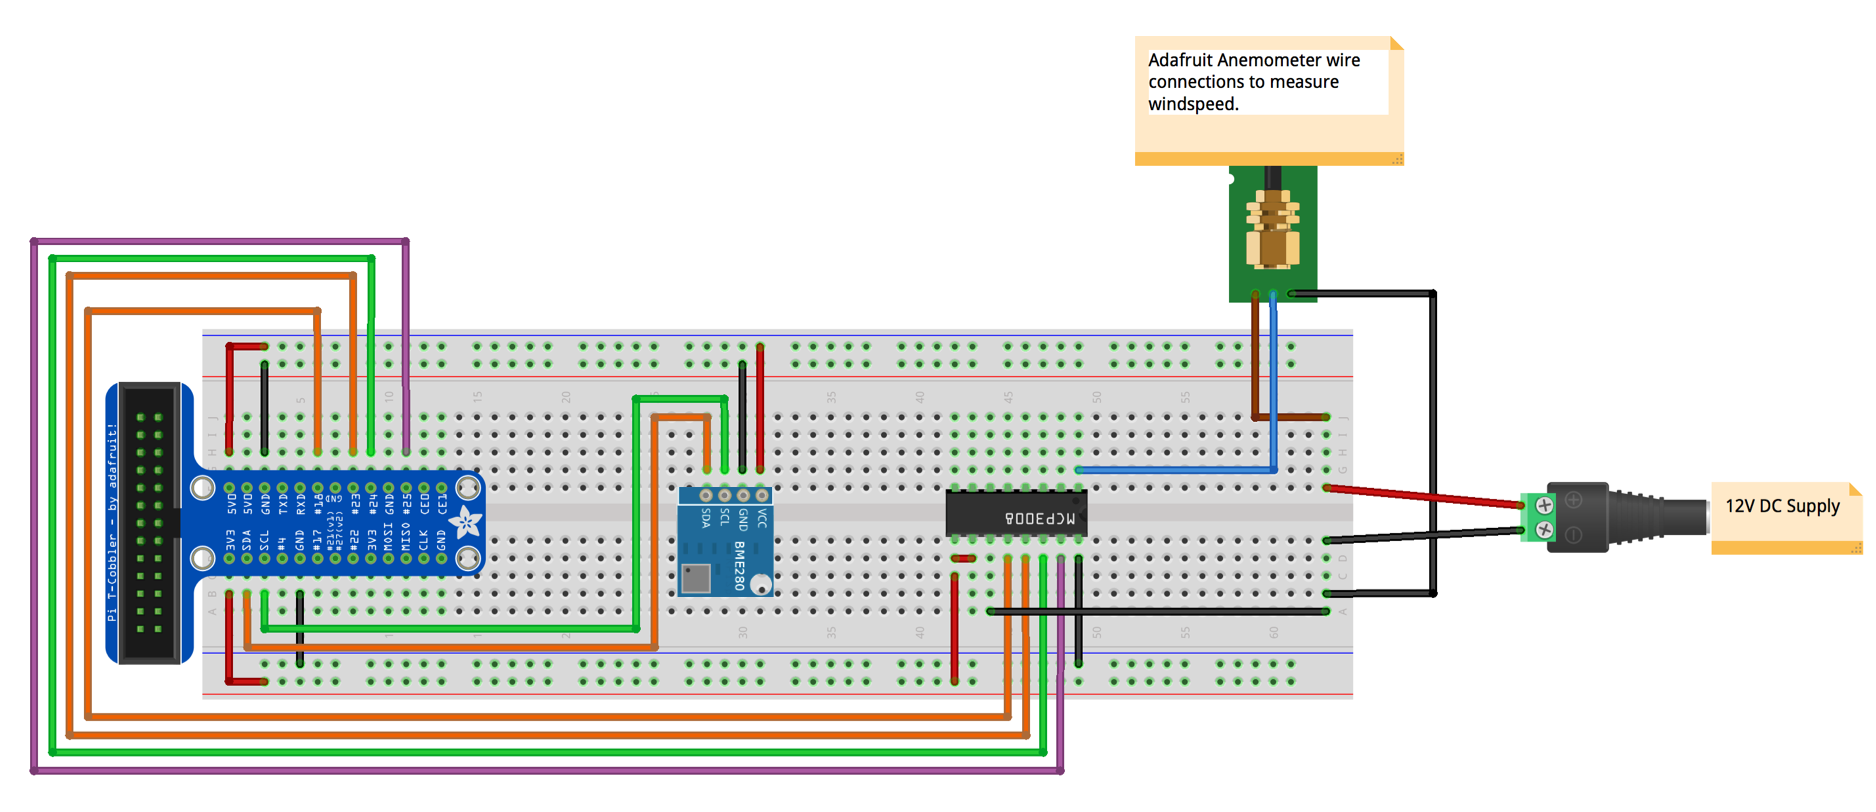
Below are some pictures of the finished breadboard and a wiring diagram you can follow. Please note the wiring diagram is organised slightly differently from the photos to ensure they’re clearer to follow as the one we built had a lot of trial and error to get working and wasn’t organised as efficiently and cleanly as it could have been:
Getting Public Weather Data
As a backup, just in case our reading’s weren’t good enough to prove the correlation between wind speed and air pressure from the Raspberry PI, we also wrote an Outlyer plugin that pulled in data from the Accuweather API’s. You can sign up for a free account using their developer platform, however even running our plugin every 30 minutes soon hit the free limits of 50 calls per day (probably because I used a bunch of calls to test the plugin) so in the end we paid the $25 for one month of their standard package so we could make calls every 30 seconds for the latest weather data without hitting any request limits. You can sign up to use the Accuweather API data here: https://developer.accuweather.com/.
You can find a custom Accuweather Outlyer integraion with a plugin and dashboard you can install here:
https://github.com/tagirsabirov/weather-sensor/tree/master/outlyer-plugin
Getting the Data into Outlyer
As we don’t provide an Outlyer agent out of the box for Raspberry PIs, we decided to use Outlyer’s Public Rest API, in particular the /series API to push multiple samples to Outlyer every 30 seconds. The final script uses the two libraries we already installed for each of the sensors above, and was run via SystemD on the Raspberry PI to ensure it stayed up and running continuously for the two week period. To use the script, just replace {OUTLYER API KEY} and {ACCOUNT NAME} with your own Outlyer account details.
"""
Measures weather sensors on Raspberry PI and sends the data to Outlyer every
30 seconds
@author Tagir Sabirov
"""
import requests
import time

# Import SPI library (for hardware SPI) and MCP3008 library.
import Adafruit_GPIO.SPI as SPI
import Adafruit_MCP3008

# Import bme280 script
import bme280

# Software SPI configuration for ADC:
CLK  = 18
MISO = 23
MOSI = 24
CS   = 25
mcp = Adafruit_MCP3008.MCP3008(clk=CLK, cs=CS, miso=MISO, mosi=MOSI)

SLEEP_TIME = 30
OUTLYER_API_KEY = "{OUTLYER API KEY}"
OUTLYER_API_URL = "https://api2.outlyer.com/v2/accounts/{ACCOUNT NAME}/series"

def send_to_outlyer(data):
    """
    Sends a reading to Outlyer
    :param data:      Array of samples
    """

    headers = {
        'Authorization': 'Bearer ' + OUTLYER_API_KEY,
        'Content Type': 'application/json',
        'Accepts': 'application/json'
    }

    resp = requests.post(OUTLYER_API_URL, json=data, headers=headers)

    if resp.status_code != 200:
        print("ERROR POSTING DATA TO OUTLYER: " +  {resp.text})

if __name__ == '__main__':
    while True:

        # Read all the ADC channel 1.
        adc_0 = mcp.read_adc(0)
        # 0.4V (125) = 0m/s -> 2.0v (625) = 32.4m/s
        # 500 steps, each step = 0.0648m/s
        wind_speed = (adc_0 - 125) * 0.0648

        # Read BME280 Readings
        temperature, pressure, humidity = bme280.readBME280All()

        # Print readings
        print("Wind Speed: " + str(wind_speed) + "m/s | Pressure: " + str(pressure) + "hPa | Temperature: "
              + str(temperature) + "C | Humidity: " + str(humidity))

        data = {
            'samples': [
                {
                    "host": "raspberry-pi",
                    "labels": {},
                    "name": "pi.wind_speed",
                    "timestamp": int(round(time.time() * 1000)),
                    "ttl": (SLEEP_TIME * 2),
                    "type": "gauge",
                    "value": wind_speed
                },
                {
                    "host": "raspberry-pi",
                    "labels": {},
                    "name": "pi.pressure",
                    "timestamp": int(round(time.time() * 1000)),
                    "ttl": (SLEEP_TIME * 2),
                    "type": "gauge",
                    "value": pressure
                },
                {
                    "host": "raspberry-pi",
                    "labels": {},
                    "name": "pi.temperature",
                    "timestamp": int(round(time.time() * 1000)),
                    "ttl": (SLEEP_TIME * 2),
                    "type": "gauge",
                    "value": temperature
                },
                {
                    "host": "raspberry-pi",
                    "labels": {},
                    "name": "pi.humidity",
                    "timestamp": int(round(time.time() * 1000)),
                    "ttl": (SLEEP_TIME * 2),
                    "type": "gauge",
                    "value": humidity
                },

            ]
        }

        send_to_outlyer(data)

        # Wait
        time.sleep(SLEEP_TIME)
To run the script via SystemD, to ensure it stays up and running continuously (and automatically restarts the script if it fails), you can add the following service definition to /lib/systemd/system/weather.service:
[Unit]
Description=Outlyer Weather Service
After=multi-user.target

[Service]
Type=idle
ExecStart=/usr/bin/python /home/pi/Documents/weather-project/measure.py
Restart=always
RestartSec=3

[Install]
WantedBy=multi-user.target
Then enable it to run automatically even when the Raspberry PI is restarted:
sudo systemctl enable weather.service
sudo systemctl start weather.service
We also created a Python script that used the Outlyer APIs to export all the datapoints into a local CSV file so Tagir could include an excel spreadsheet of the results for his project:
"""
Exports the weather data to a CSV file for Excel analysis from Outlyer.
Usage:
        python3 export-data.py --apikey={PUT OUTLYER API KEY HERE} --account={PUT OUTLYER ACCOUNT NAME HERE} --file={PATH TO FILE}
@author Tagir Sabirov
"""

from argparse import ArgumentParser
import requests
import time
import csv

METRICS = [
    'accuweather.temp_c',
    'accuweather.wind_speed_kmh',
    'accuweather.windgust_speed_kmh',
    'accuweather.uvindex',
    'accuweather.visibility_km',
    'accuweather.cloudcover_pct',
    'accuweather.cloud_ceiling_m',
    'accuweather.pressure_mb',
    'accuweather.precipitation_mm',
    'pi.wind_speed',
    'pi.pressure',
    'pi.temperature',
    'pi.humidity'
]

class OutlyerAPI(object):

    OUTLYER_API_URL = "https://api2.outlyer.com/v2/accounts/"

    def __init__(self, apiKey:str, account: str):
        self.apiKey = apiKey
        self.account = account

    def queryOutlyerSeries(self, startTime:str, query:str, endTime:str = "now"):
        """
        Sends a reading to Outlyer
        :param data:      Array of samples
        """

        headers = {
            'Authorization': 'Bearer ' + self.apiKey,
            'Content Type': 'application/json',
            'Accepts': 'application/json'
        }

        params = {
            'e': endTime,
            's': startTime,
            'q': query
        }

        resp = requests.get(self.OUTLYER_API_URL + self.account + "/series",
                            headers=headers, params=params)

        if resp.status_code != 200:
            print("ERROR GETTING DATA FROM OUTLYER: " + {resp.text})
            return None

        return resp.json()

if __name__ == '__main__':

    # Get command line arguments to get Outlyer API key
    parser = ArgumentParser()
    parser.add_argument("-k", "--apikey", dest="apikey",
                        help="Pass in your Outlyer API Key", required=True)
    parser.add_argument("-a", "--account", dest="account",
                        help="Pass in your Outlyer Account Name", required=True)
    parser.add_argument("-f", "--file", dest="file",
                        help="Path to output CSV File", default='weather_data.csv')

    args = parser.parse_args()
    exporter = OutlyerAPI(args.apikey, args.account)

    print(f"Writing to file {args.file}")

    with open(args.file, "w+") as csvfile:

        csvwriter = csv.writer(csvfile, delimiter=',',
                        quotechar='|', quoting=csv.QUOTE_MINIMAL)

        header = None

        # Get last week of data for each metric
        for metric in METRICS:
            query = f"name,{metric},:eq,:max,:cf-max"
            data = exporter.queryOutlyerSeries("e-1w", query)

            interval = data['interval']
            start = data['start']
            end = data['end']
            values = data['values'][0]

            print(f"{metric}: Downloaded {len(values)} datapoints between "
                  f"{time.strftime('%Y-%m-%d %H:%M:%S', time.localtime(start / 1000))} and "
                  f"{time.strftime('%Y-%m-%d %H:%M:%S', time.localtime(end / 1000))} "
                  f"every interval {interval / 60000} minutes.")

            # Only write header if first metric
            if not header:
                timestamp = start
                header = ['metric']
                while timestamp <= end:
                    header.append(time.strftime('%Y-%m-%d %H:%M:%S', time.localtime(timestamp / 1000)))
                    timestamp += interval
                csvwriter.writerow(header)

            # Change None values to empty string values
            row = [metric]
            for value in values:
                if value:
                    row.append(str("%.4f" % round(value,4)))
                else:
                    row.append('')

            csvwriter.writerow(row)
You can find the full source code for the project here:
https://github.com/tagirsabirov/weather-sensor
The Final Results: Analysing the Data in Outlyer
For the experiment, we collected 2 weeks of data every 30 seconds, around 524,000 datapoints in total, which we were able to build a dashboard and analyse in Outlyer quickly to see the correlation between wind speed and air pressure.
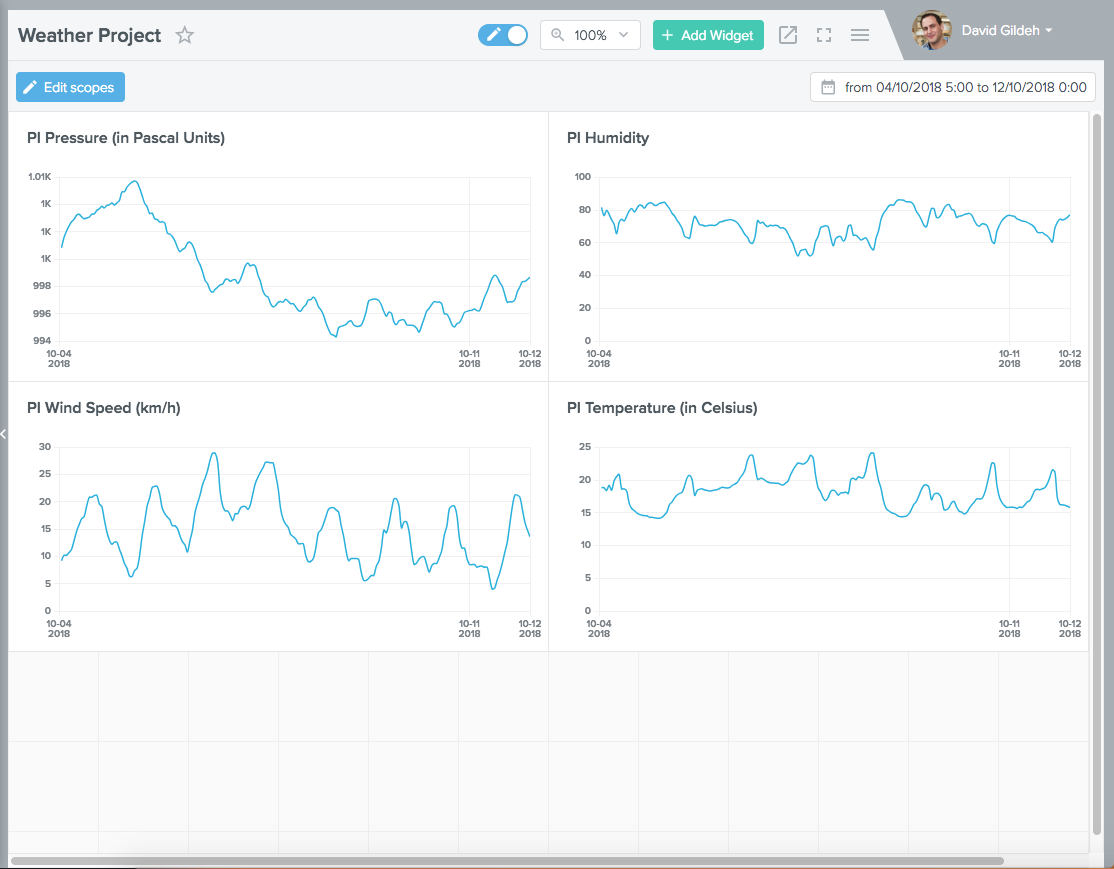
As you can see there is an inverse correlation between air pressure and wind speed; as air pressure drops, the wind speed increases.
We also noticed there was an inverse correlation between air temperature and humidity, using the data from the additional sensors on the BME280 chip. This is because we are measuring relative humidity, or the ratio of the amount of moisture actually in the air to the maximum amount that can be present at that temperature. Because warm air can hold more water vapor than cool air, relative humidity falls when the temperature rises if no moisture is added to the air, resulting in the inverse correlation.
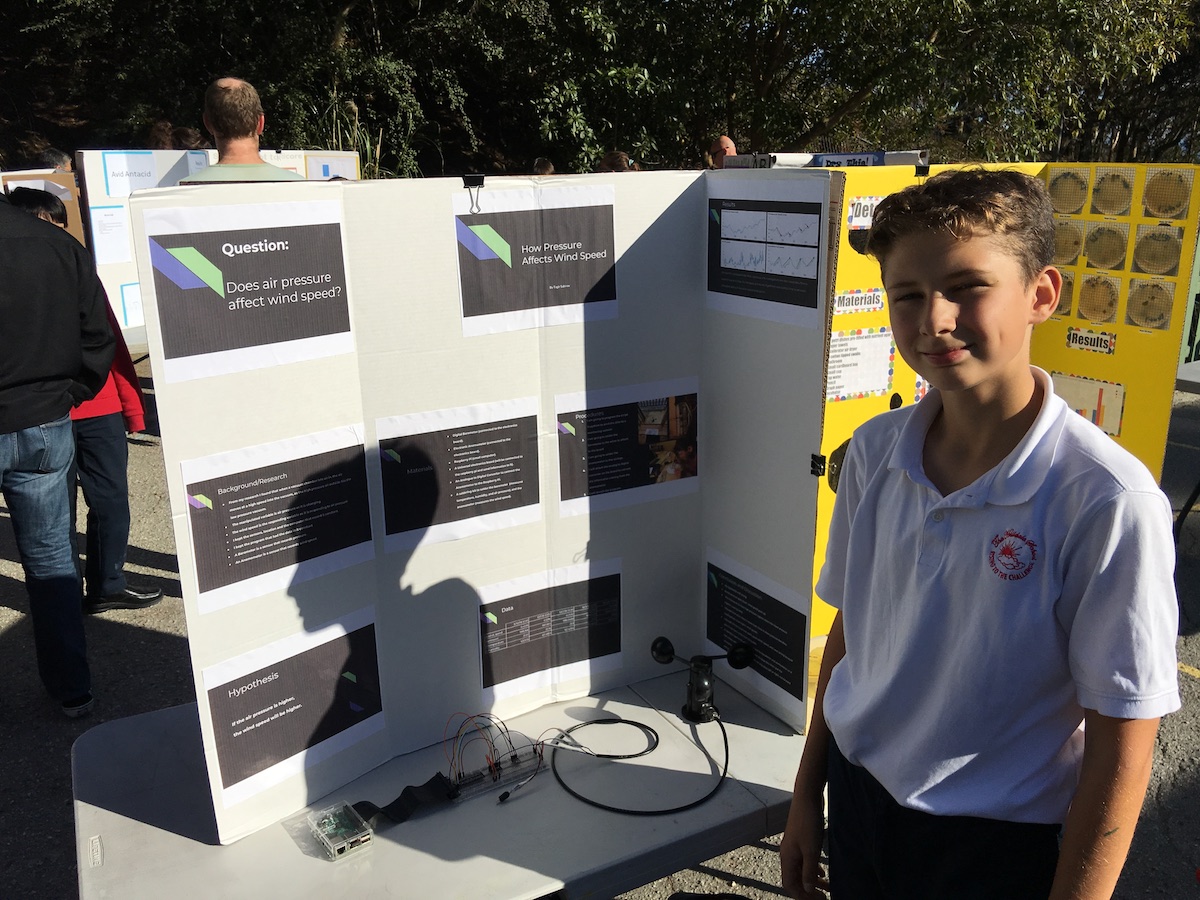
Overall this was a great science project, and I would recommend any parent who wants to teach their kids basic electronics and programming to try this out, as its not too hard and covers a lot of concepts such as electronics, soldering, writing Python and using REST APIs. Here’s my son at the science fair showing off the final results:

Leave a comment