Running Python OpenTelemetry with Google Cloud Run
ByI’ve been playing with OpenTelemetry in my spare time because of a general interest for my current role heading up Telemetry at Netflix as it appears to be gaining traction in the industry as a standardized way of collecting traces, metrics and logs for Observability. While experimenting I also came across Google Cloud Run, which is mostly awesome, so I tried to instrument a simple Python (my current language of choice) microservice app to run on it with tracing instrumented so I could see all the requests and track issues/performance in Google Cloud Trace.
However, both of them are either really new and immature (OpenTelemetry) or really new and lacking documentation in some areas (Google Cloud Run) so it took me a lot of debugging time to figure out how to get everything working and connected together, even with some help on StackOverflow (here & here, with the second one costing me 50 reputation points for a bounty that didn’t get a response!). So after all that effort, I thought I’d share my learnings here for the next pioneers to save a few hours trying to figure it out themselves!
Why Make All The Effort?
There are much simpler appraoches I could have taken to get 2 microservices up and running with instrumentation, but this project was a good chance for me to learn gRPC, OpenTelemetry and Google Cloud Run all at once. gRPC is used heavily in microservices we monitor at Netflix, and although we have no current plans to use OpenTelemetry, with the industry momentum behind it I’m actively keeping an eye on it as it matures.
The problem OpenTelemetry is aiming to solve is that collection has become a commodity; every observability solution aims to collect the 3 signals required to troubleshoot production issues: metrics, traces & logs, and because signals like traces require deep instrumentation into your codebase to pass trace contexts between services, the risk to users is you put libraries and a lot of code into your services that may eventually have to be re-written if you decide to switch observability tooling down the road. OpenTelemetry aims to provide a standard library/API for users to instrument their apps, and an exporter model that allows you to easily change where you send the data without having to re-write all your instrumentation.
Google Cloud Run is exciting as it’s fully serverless, using Knative (serverless Kubernetes) to run containers, with a fantastic pricing model! You essentially build and deploy your microservices as containers, and only pay for the compute time when those containers are running. If you have low volume services, it will kill all your containers, and in seconds quickly spin them up if a request comes in, and as the volume of requests increases, can auto-scale up to handle the load. No infrastructure to manage, no charge when your service isn’t being used, and all the benefits of running containers instead of functions, so you can include all the libraries and binaries you need for your service to run, easily.
The Architecture
You can find the code for this with all the libraries to get started here: https://github.com/dgildeh/otel-python-cloud-run
The project essentially has two services and a common shared lib:
- API-Service: This service provides a REST API using the FastAPI framework which is probably Python’s most performant OpenAPI framework, making it easy to provide API documentation out of the box too! If building Restful services, I would highly recommend using an OpenAPI framework, as it makes consumption by other developers so much easier with automated documentation and the ability to automatically generate clients in most languages from the doc spec too.
- Backend-Service: This service is a gRPC server running the backend written using Python’s gRPC module to reply back to the calling API-Service.
- Common-Lib: This provides the common observability classes and the Client/Proto interfaces for the Backend-Service for other services like the API-Service to consume. This should be imported into all microservices to provide a common logging/tracing setup and ensure that services can easy connect to each other via gRPC.
Both services are instrumented using the most recent stable version of OpenTelemetry (when using all the modules required, which are currently out of sync with the V1 Python SDK) to provide end to end tracing to Google Trace/Logs. The user facing API-Service is deployed publicly so any unauthenticated user can make an API request, and the Backend-Service is deployed privately and only accessible from other services like the API-Service. This actually lead to my first problem to figure out as the documentation is poor for this area, how to get the two services talking to each other with one privately deployed.
It turns out you need to setup a Severless VPC Connector, and attach to any calling services (i.e. the api-service), and set ingress so all traffic goes through the VPC network. It turns out making a service “private” is really just a bunch of network firewall rules, the service still has a public URL, you just can’t make a request to it unless you’re on the shared VPC network and have the correct authentication setup for your service’s service account. That’s the second part, all your services must talk over SSL/HTTPS (secure channels for gRPC), and have a JWT Bearer Authentication Token set in the header/gRPC metadata to invoke the backend service. This requires setting up a service account for your container to use on Google Cloud Run, and best practice is to setup a service account for each service. I setup two: api-service and backend-service, and you need to give all your client (calling) services the following IAM roles for it all to work:
- Cloud Run Invoker: Required so the service account can call (invoke) other Cloud Run services
- Serverless VPC Access User: Required to connect to the Serverless VPC Connector to send traffic to the internal VPC network
- Cloud Trace Agent: Required for sending traces using the OpenTelemetry exporter to Google Cloud Trace
The gRPC server only requires the Cloud Trace Agent role unless it’s calling other internal microservices on Google Cloud Run, but for simplicity I have setup both service accounts with the same roles for the demo.
Luckily I’ve done all the hard work for you via bash scripts using Google Cloud’s CLI so you can just run that to get everything deployed in a few minutes.
Distributed Tracing with OpenTelemetry
Now that the two services are deployed on Google Cloud Run, we need to be able to link them together with a common trace context so we can see all the trace spans, and related logs linked together in Google Trace. Google Cloud uses the ‘X-Cloud-Trace-Context’ header to pass trace/span IDs between services. By using this propagation header on Google Cloud Run, we can also join up traces with intermediate services used by Cloud Run such as the Cloud Load Balancer that starts the request, and the AppServer that runs the container on Google Cloud Run, and also both appear to emit spans during a request. From my testing it doesn’t appear that they support the new standard W3C propagation headers for Google’s intermediate services, so for now we’ll need to use the vendor specific ‘X-Cloud-Trace-Context’ header to link everything together. Another point to note is that Google’s current Cloud Propogator module doesn’t work with gRPC as it has upper-case letters (not supported in the gRPC metadata key standard) so I had to cut and paste their class and lowercase the key until they fix the issue themselves.
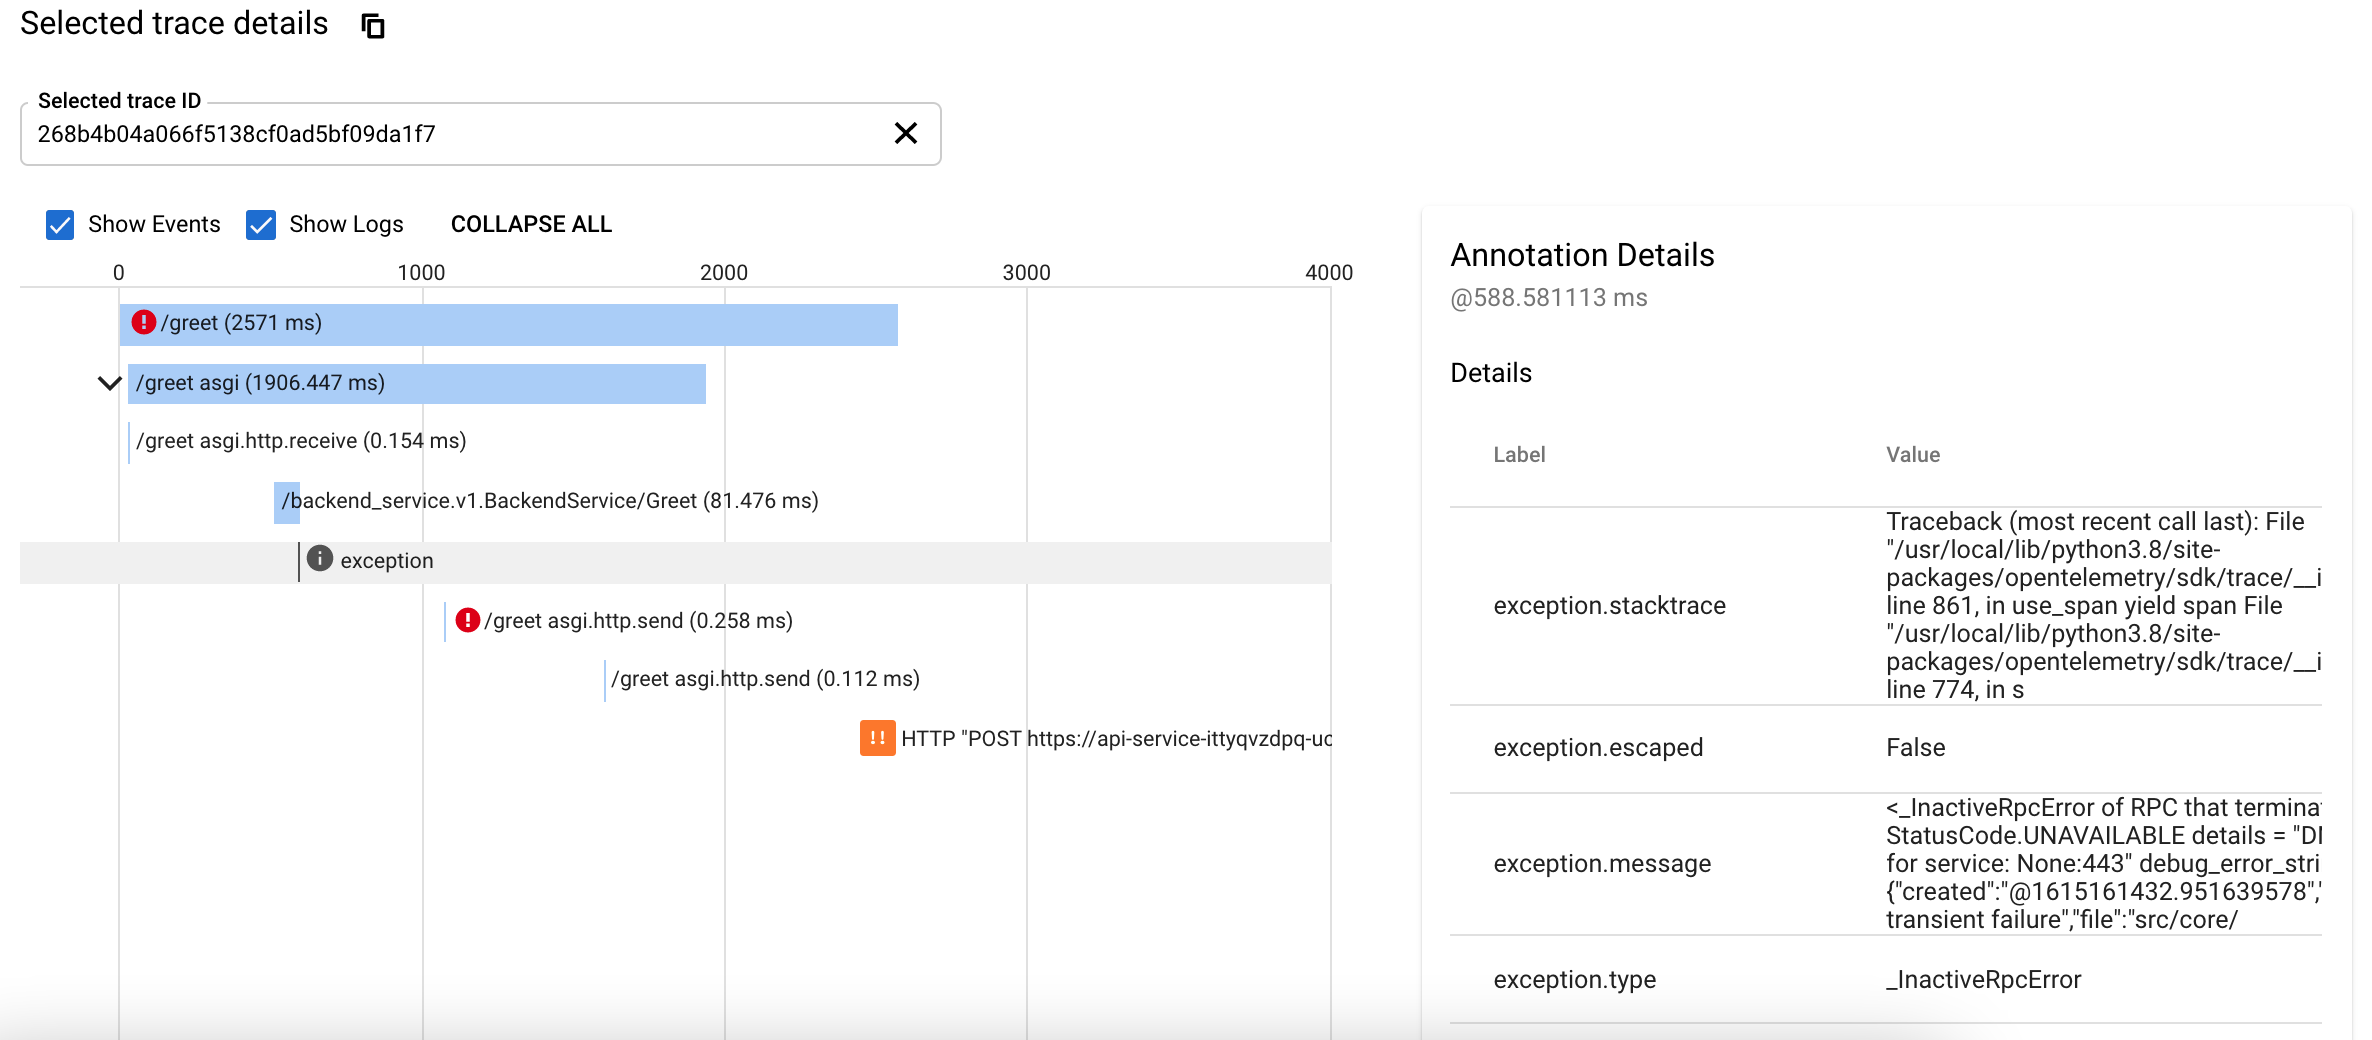
Another issue (testament to how immature OpenTelemetry is right now) is the opentelemetry-grpc-instrumentation library seems to have a flag to differentiate between instrumenting insecure and secure gRPC channels on the Client. This meant my app worked locally on my laptop, but stopped linking traces together when deployed to Google Cloud Run, which requires a secure gRPC channel. Debugging through the code finally solved this issue (with lots of deployments to test ideas!) and I’m not sure why they made that design decision so have put another Github issue for that to hopefully make it more obvious in future.
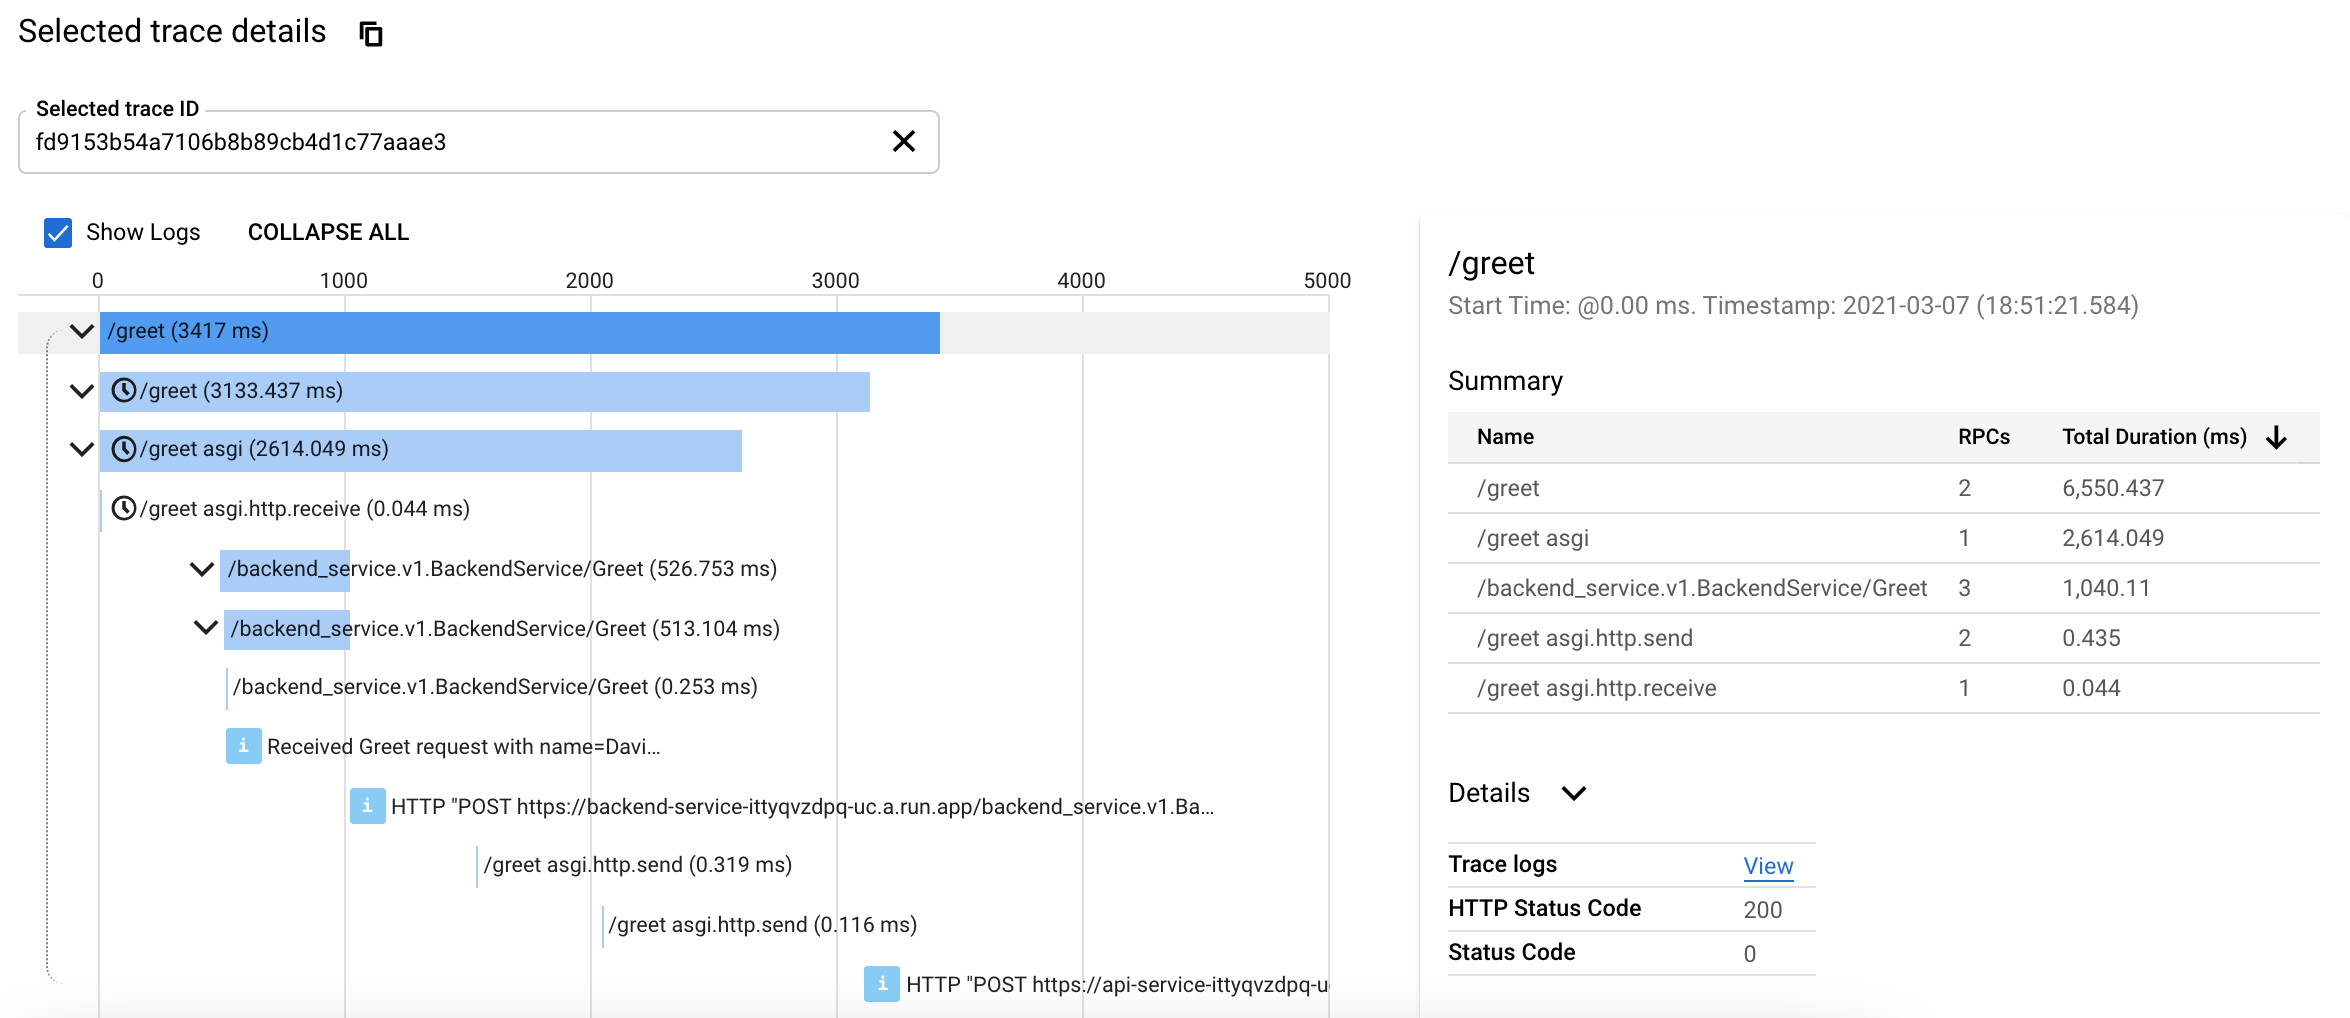
However, after all that effort, you can see below the app deploys, works and provides end-to-end traces on Google Trace:
OpenTelemetry Feedback
I had the opportunity to connect with Ted Young recently, who initially founded and runs the OpenTelemetry project. He told me that now V1 is out as a release candidate, and the tracing standard/APIs are stable, the next area of focus was improving the auto-instrumentation. In my apps I used the gRPC and FastAPI instrumentation modules to automatically instrument my services. The FastAPI instrumentation is much better documented and works compared to gRPC showing the significant gap between the maturity of instrumentation modules today, so I’m happy to see this will be the next area of focus for the project.
One of the things I noticed however is that each instrumentor uses its own conventions and labels to annotate spans, and there’s no way to “hook” into them easily and add your own annotations easily during a request. My hope is that the project standardizes these across all the different instrumentors and exporters so it’s easy to make sense of a trace while traversing the spans. For example, some instrumentation sets status codes on the trace to indicate errors (useful when looking for an issue in a distributed system), some don’t. There doesn’t appear to be a common ‘service’ label so I can group all my spans and filter on a particular service for my traces. The span names and labels for Flask (which I tried separately) and FastAPI are different, despite both being HTTP services.
The list goes on, but overall I’d expect a common set of labels for services, a common set of labels and formatting of the values for each protocol (HTTP/gRPC) and common error handling too before we can get the full “instant” benefit of auto-instrumentation. This also applies to metrics when those get to V1 too.
I’d also like to see some documentation for each framework, or “hooks” so that I can apply my own span attributes each time a new request span is created/ended easily if needed (i.e. a user ID so I can filter traces for a specific user).
Summary
I think both OpenTelemetry and Google Cloud Run have a LOT of potential for the future, but right now are probably a little immature for serious production workloads. However, time will solve these issues, and if your service isn’t highly critical (yet) and you’re just getting started, I suspect in the longer term (months, or a year maybe) the investment will pay dividends in the simplicity and cost reduction of not having to run your own service infrastructure on Google Cloud Run, and all the free instrumentation and support that will come from OpenTelemetry as it grows and matures. Hopefully in the interim until these both become mainstream choices, this blog will save you a few hours getting to a working service!
In case you missed it above, all the source code for this project can be found here: https://github.com/dgildeh/otel-python-cloud-run

[…] I’ve been playing with OpenTelemetry in my spare time because of a general interest for my current role heading up Telemetry at Netflix as it appears to be gaining traction in the industry as… Read more […]
This is exactly what I’m trying to do at the moment and it will save me more than a few hours, thanks!
No worries, that was the intention! Just FYI that I’ve got some improvements to make upgrading all the OpenTelemetry libraries to latest stable versions and using BatchSpanExporter instead of SimpleSpanExporter – through those 2 changes my requests went from 2-3 seconds for what is essentially a very simple REST API call to 200-300ms that you would expect. Will push an update hopefully in the next few days!